

The confusion matrix is a valuable tool in machine learning, helping us measure the performance of classification models. Using sklearn, a popular Python library makes creating and understanding this sklearn confusion matrix easier. In this guide, we’ll break it all down into simple terms, so even a 10-year-old can understand it.
What is a Confusion Matrix?
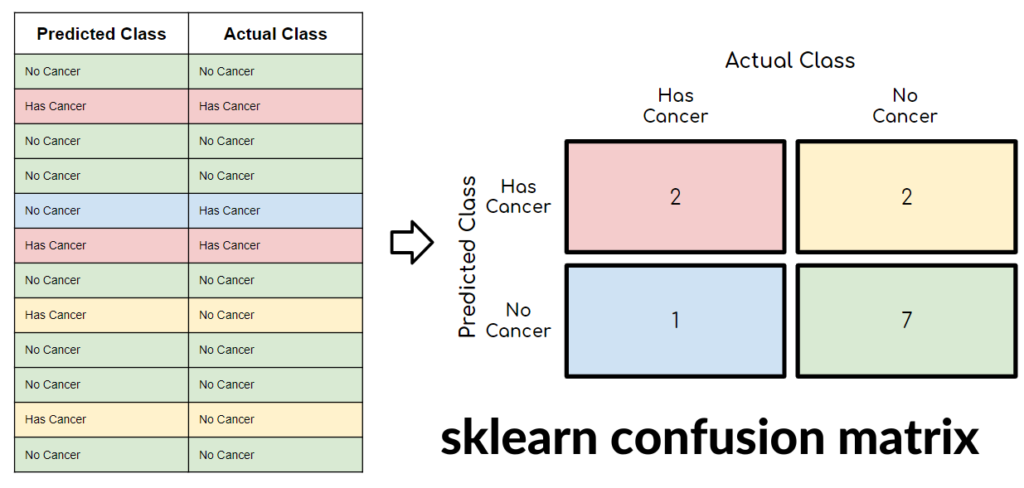
A confusion matrix is a table that shows how well a machine learning model performs in classifying data into categories. Sklearn confusion matrix It compares the predicted values from the model to the actual values in the dataset.
For example, imagine you have a machine that sorts fruits into “apples” and “oranges.” Sometimes, the machine makes mistakes, like putting an orange into the apple basket. A confusion matrix shows you how often these mistakes happen and how often the machine gets it right.
In simple terms, it’s a way to measure accuracy and errors to improve your program.
Why is it Called a ‘Confusion’ Matrix?
The name “confusion matrix” comes from the fact that it shows where the model gets “confused.” For instance:
- It might think an orange is an apple.
- It might also think an apple is an orange.
These errors are displayed in the matrix, making it clear what kind of confusion the model has when making predictions.
How Does sklearn Help Us?
sklearn, short for scikit-learn, is a powerful Python library for machine learning. It makes creating and analyzing a confusion matrix simple and efficient. With just a few lines of code, you can generate a confusion matrix and use it to evaluate your model’s performance.
Let’s dive deeper with an example to see how sklearn works.
Setting Up Our Fruit Sorting Example
Imagine you have a program to sort fruits into apples and oranges. sklearn confusion matrix You test the program with 100 fruits:
- 60 are apples, and 40 are oranges.
- The program predicts correctly 90% of the time but makes mistakes 10% of the time.
This is where the confusion matrix becomes helpful. It will show how often the program gets the classifications correct and where it makes mistakes.
Creating the Confusion Matrix with sklearn
Here’s how you can create a confusion matrix using sklearn:
python
Copy code
from sklearn.metrics import confusion_matrix
# Actual labels (true values)
actual = [‘apple’, ‘apple’, ‘orange’, ‘apple’, ‘orange’, ‘orange’, ‘apple’]
# Predicted labels (model predictions)
predicted = [‘apple’, ‘orange’, ‘orange’, ‘apple’, ‘orange’, ‘apple’, ‘apple’]
# Create a confusion matrix
matrix = confusion_matrix(actual, predicted, labels=[‘apple’, ‘orange’])
print(matrix)
This code generates a 2×2 matrix showing:
- True positives (correctly identified apples)
- True negatives (correctly identified oranges)
- False positives (oranges predicted as apples)
- False negatives (apples predicted as oranges)
Why is the Confusion Matrix Useful?
The confusion matrix helps you pinpoint errors and understand your model’s strengths and weaknesses. For example:
- Are there too many false positives or false negatives?
- Is the model good at identifying one class but struggles with another?
By answering these questions, you can make better decisions about improving your program.
Here’s a general example of what a bio table might look like:
| Attribute | Details |
|---|---|
| Name | John Doe |
| Age | 30 |
| Profession | Software Developer |
| Location | San Francisco, CA |
| Education | B.S. in Computer Science, Stanford |
| Skills | Python, Java, Machine Learning |
| Achievements | Developed XYZ app, Speaker at ABC conference |
| Interests | Traveling, Photography |
Feel free to provide more context, and I can customize the table accordingly!
Making Our Sorting Program Better
After analyzing the confusion matrix, you might notice specific patterns in the errors. For instance:
- If the program struggles to identify small apples, you could improve its training data by including more examples of small apples.
- If oranges with a specific color are misclassified, you could adjust the model to consider color features more accurately.
By using insights from the confusion matrix, you can create a smarter and more reliable program.
How Sklearn Helps with Confusion Matrices
sklearn provides tools to calculate additional metrics using the confusion matrix, such as:
- Accuracy: The percentage of correct predictions.
- Precision: How often the model is correct when it predicts a specific class.
- Recall: How well the model identifies all items of a particular class.
These metrics give you a deeper understanding of your model’s performance and guide improvements.
Breaking Down the Confusion Matrix
To better understand the confusion matrix, let’s explore its four main components:
True Positives and True Negatives
- True Positives (TP): Items correctly classified as belonging to a category (e.g., apples identified as apples).
- True Negatives (TN): Items correctly identified as not belonging to a category (e.g., oranges identified as oranges).
False Positives and False Negatives
- False Positives (FP): Items incorrectly classified as belonging to a category (e.g., oranges identified as apples).
- False Negatives (FN): Items incorrectly classified as not belonging to a category (e.g., apples identified as oranges).
Why These Terms Matter
Understanding these terms is crucial because they help you evaluate specific types of errors. For example:
- A high number of false positives could indicate the model is overly confident.
- A high number of false negatives might mean the model is missing key patterns in the data.
Steps to Create a Confusion Matrix with Sklearn
Creating a confusion matrix using sklearn is straightforward. Follow these steps:
- Import the Required Libraries: Import sklearn’s confusion_matrix and other necessary modules.
- Prepare the Data: Create lists for the actual and predicted values.
- Generate the Matrix: Use confusion_matrix(actual, predicted) to calculate the confusion matrix.
- Analyze the Matrix: Interpret the results to understand the model’s performance.
The Bottom Line
The confusion matrix is an essential tool for understanding and improving machine learning models. By leveraging sklearn, you can quickly generate and analyze this matrix to identify errors, calculate metrics, and make your model more effective. Whether you’re sorting fruits or solving more complex problems, understanding the confusion matrix is key to building smarter and more reliable programs.
With sklearn’s simplicity and the confusion matrix’s insights, you’ll be well on your way to mastering machine learning.